Quantitative research / point-in-time validation
Point-in-Time S&P 500 Return Modeling
I built a point-in-time stock panel to test whether a small set of price and risk features could rank stocks out of sample. The page shows both the promising part of the result and the checks that made the conclusion weaker.
Research question
Can a stock-ranking model beat a simple baseline after costs when membership and dates are frozen?
I started with historical prices, built risk and return features, and kept tightening the evaluation design. The final version uses historical S&P 500 membership, a 12-month feature window, non-overlapping quarterly targets, an eight-quarter holdout, five-stock portfolios, and a 0.5% transaction cost per turnover.
End-to-end process
From raw prices to a defensible conclusion
- A
1. Static price data
Use a static, reproducible price source so the experiment is not dependent on a live API or rate limits.
- B
2. Data cleaning and outlier detection
Align dates, repair missing values, flag implausible price jumps, and preserve an audit trail.
- C
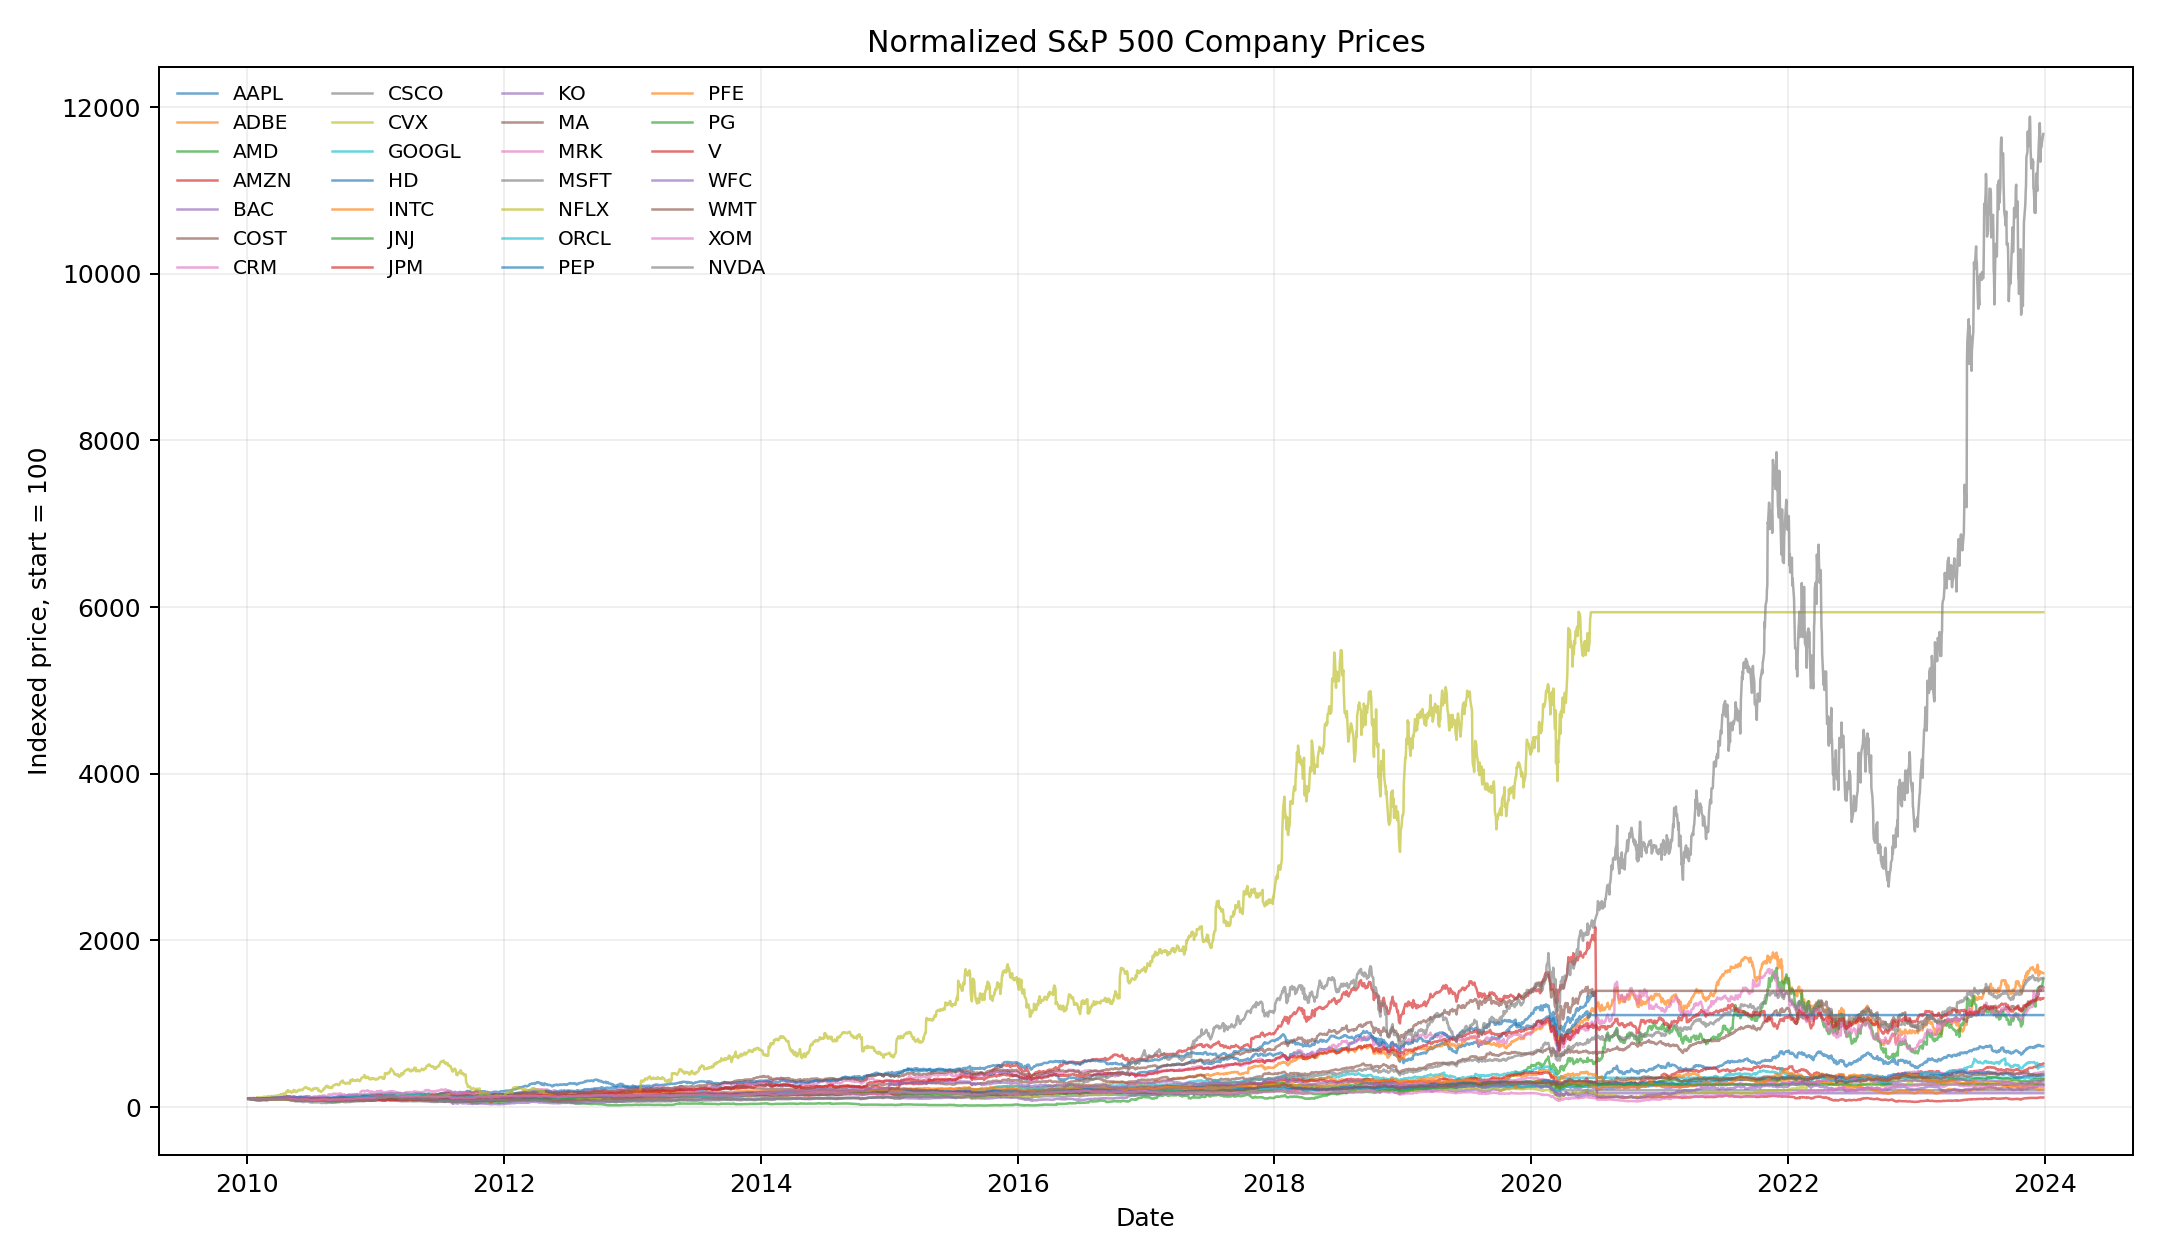
3. Descriptive analysis and visualization
Inspect normalized price paths, annual returns, correlations, and distributional behavior.
- D
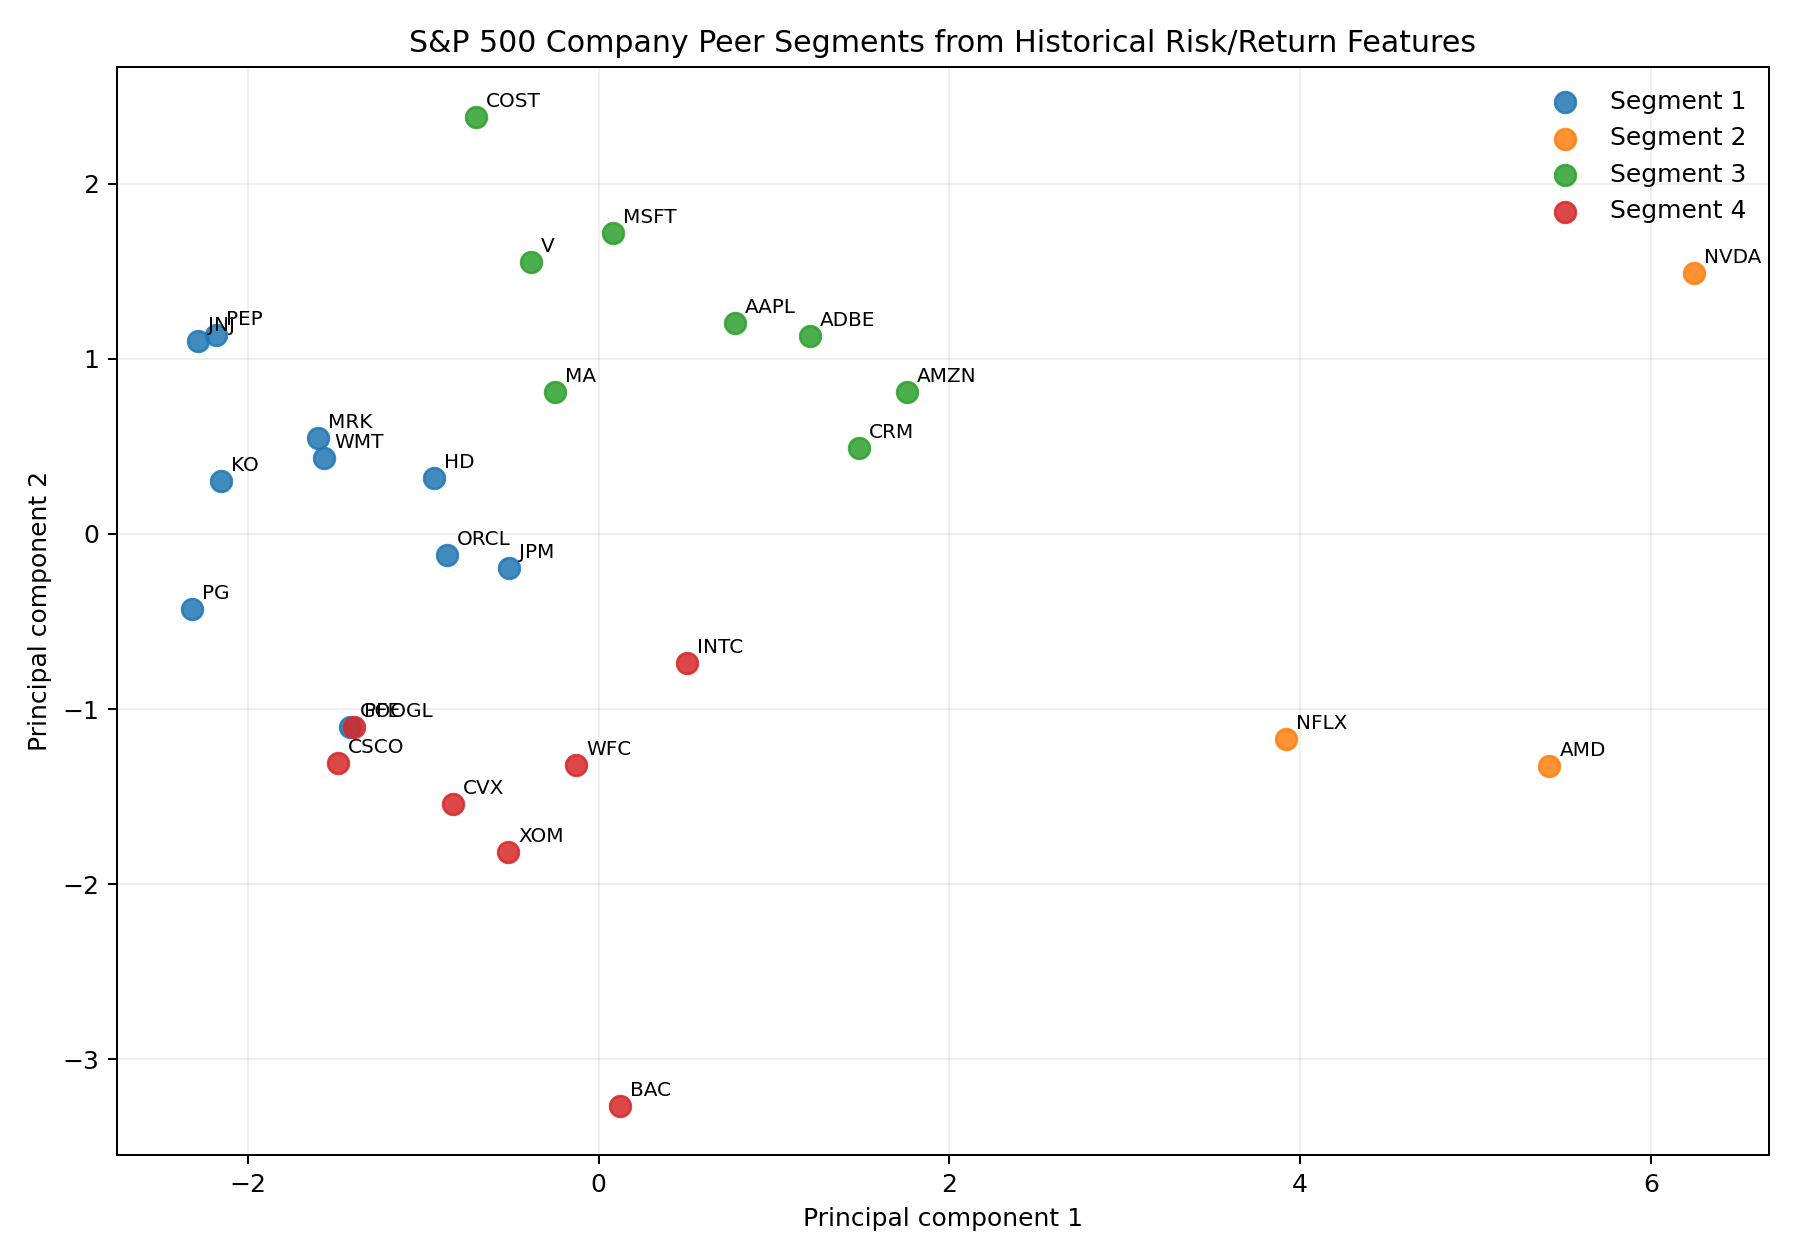
4. Risk/return features and peer groups
Construct return, volatility, drawdown, persistence, and PCA-based company profiles.
- E
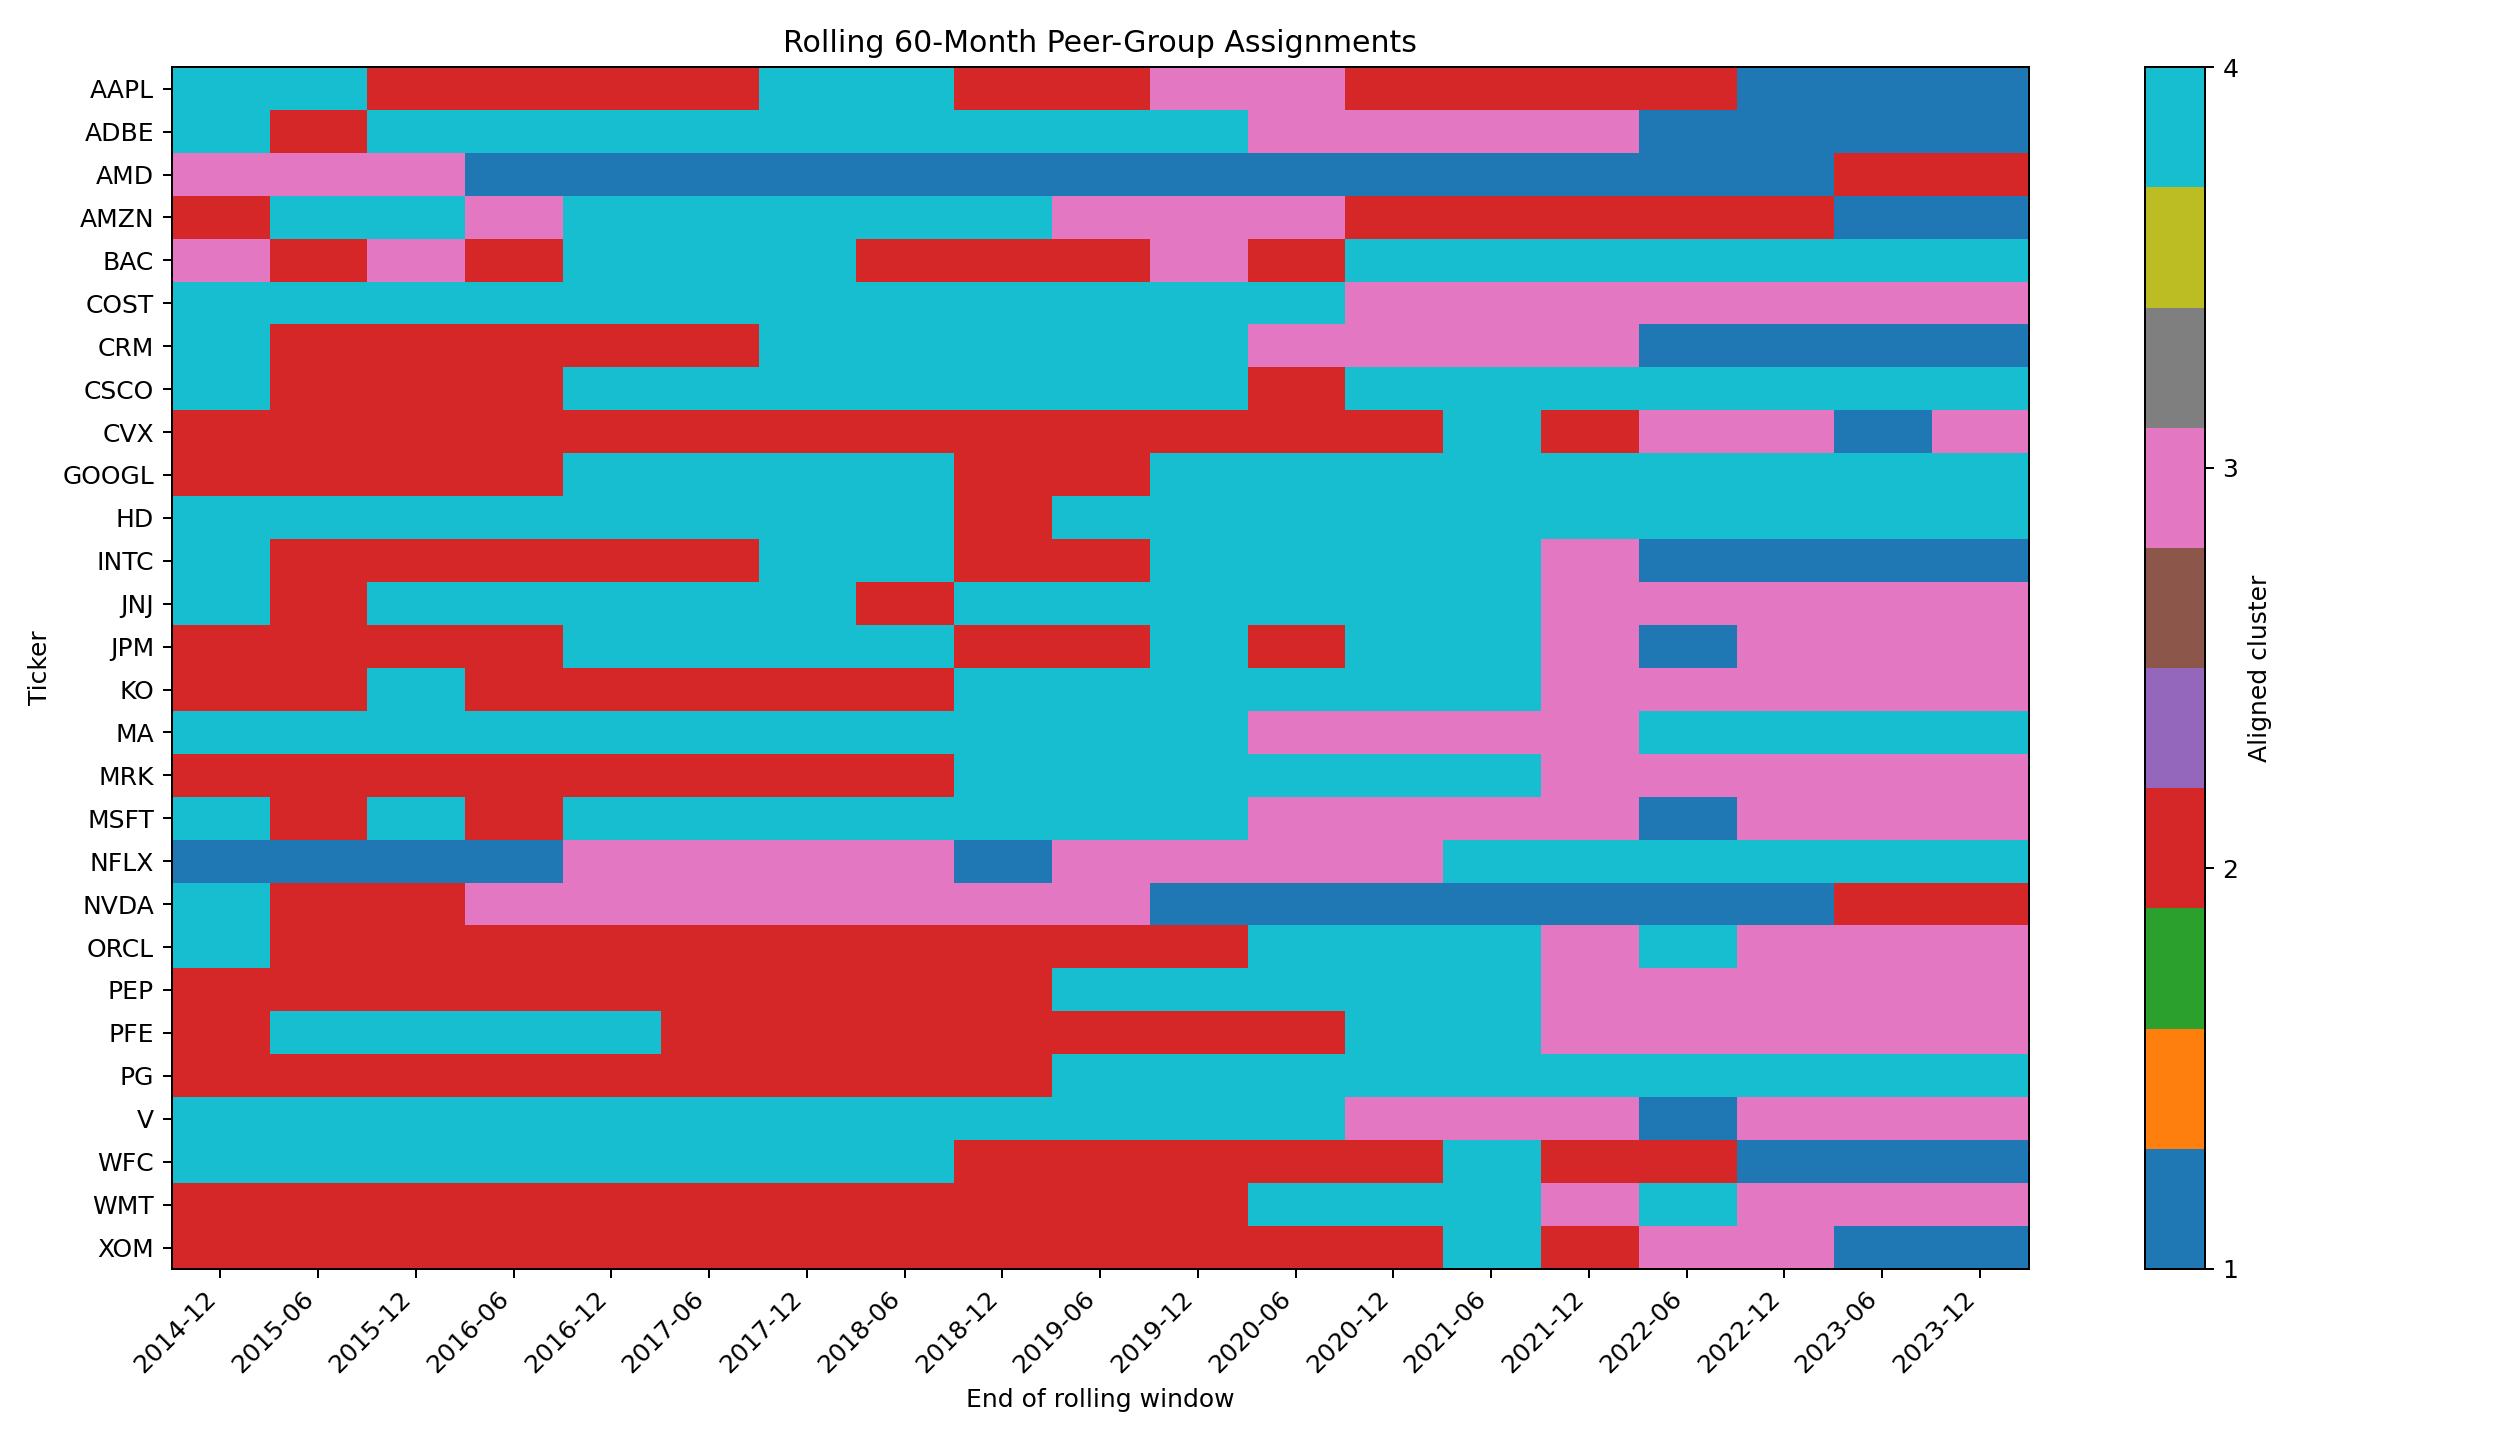
5. Rolling clustering and market regime
Re-estimate peer groups through time and add point-in-time volatility/regime information.
- F
6. Prediction models and strategy backtest
Compare frozen model families and evaluate top-N portfolios after turnover costs.
- G
7. Point-in-time and historical membership
Use historical index membership and only information available at each evaluation date.
- H
8. Placebo, bootstrap, and Reality Check
Test whether the observed result survives random portfolios, dependence-aware resampling, and model selection.
- I
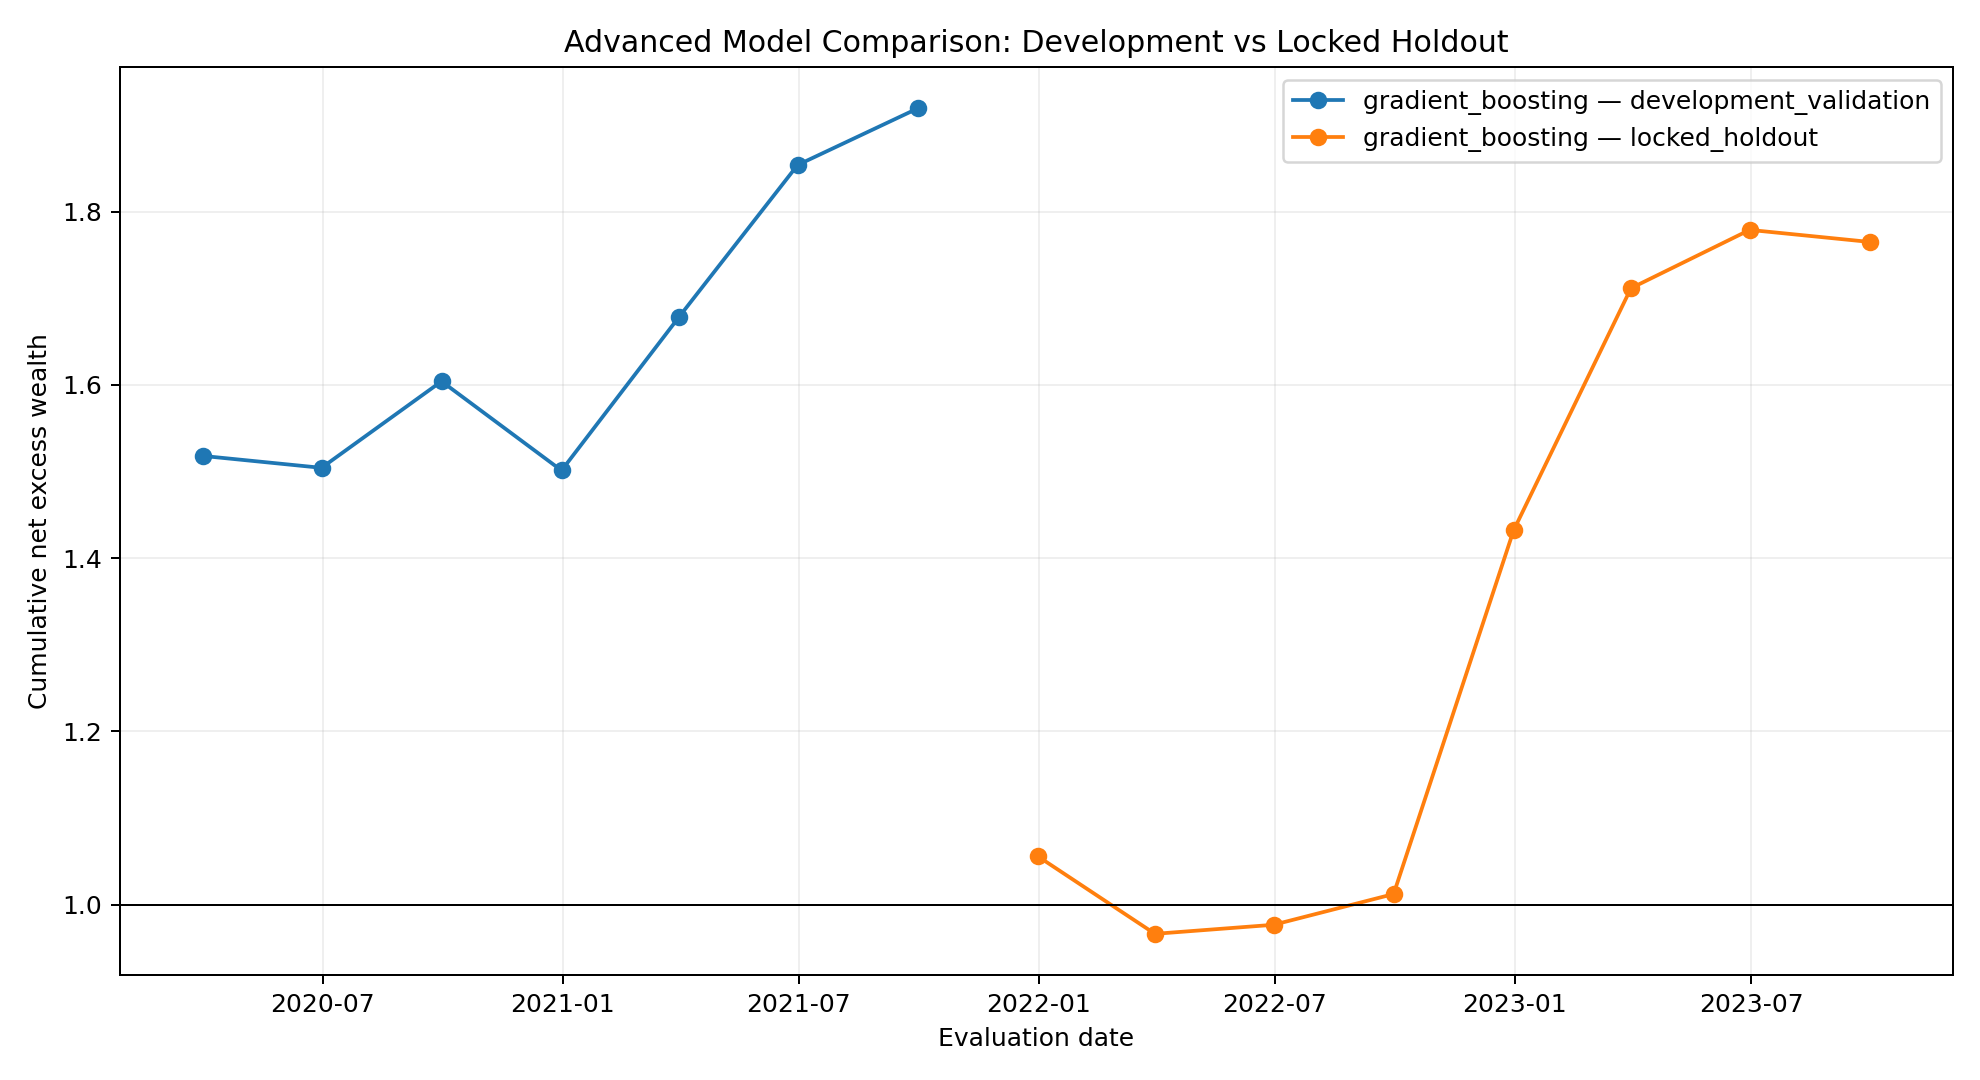
9. Locked out-of-sample holdout
Evaluate the frozen specification on eight quarterly periods that were not used for development.
- J
10. Advanced Gradient Boosting
Use the selected nonlinear model only after the validation design is fixed.
- K
11. Fair comparison of new factors
Add momentum and risk blocks without changing the baseline universe or model parameters.
- L
12. Final report and conclusion
Separate exploratory evidence from confirmatory evidence and document limitations.
Visual evidence
What the data and selected portfolios look like
Model comparison
Locked holdout performance
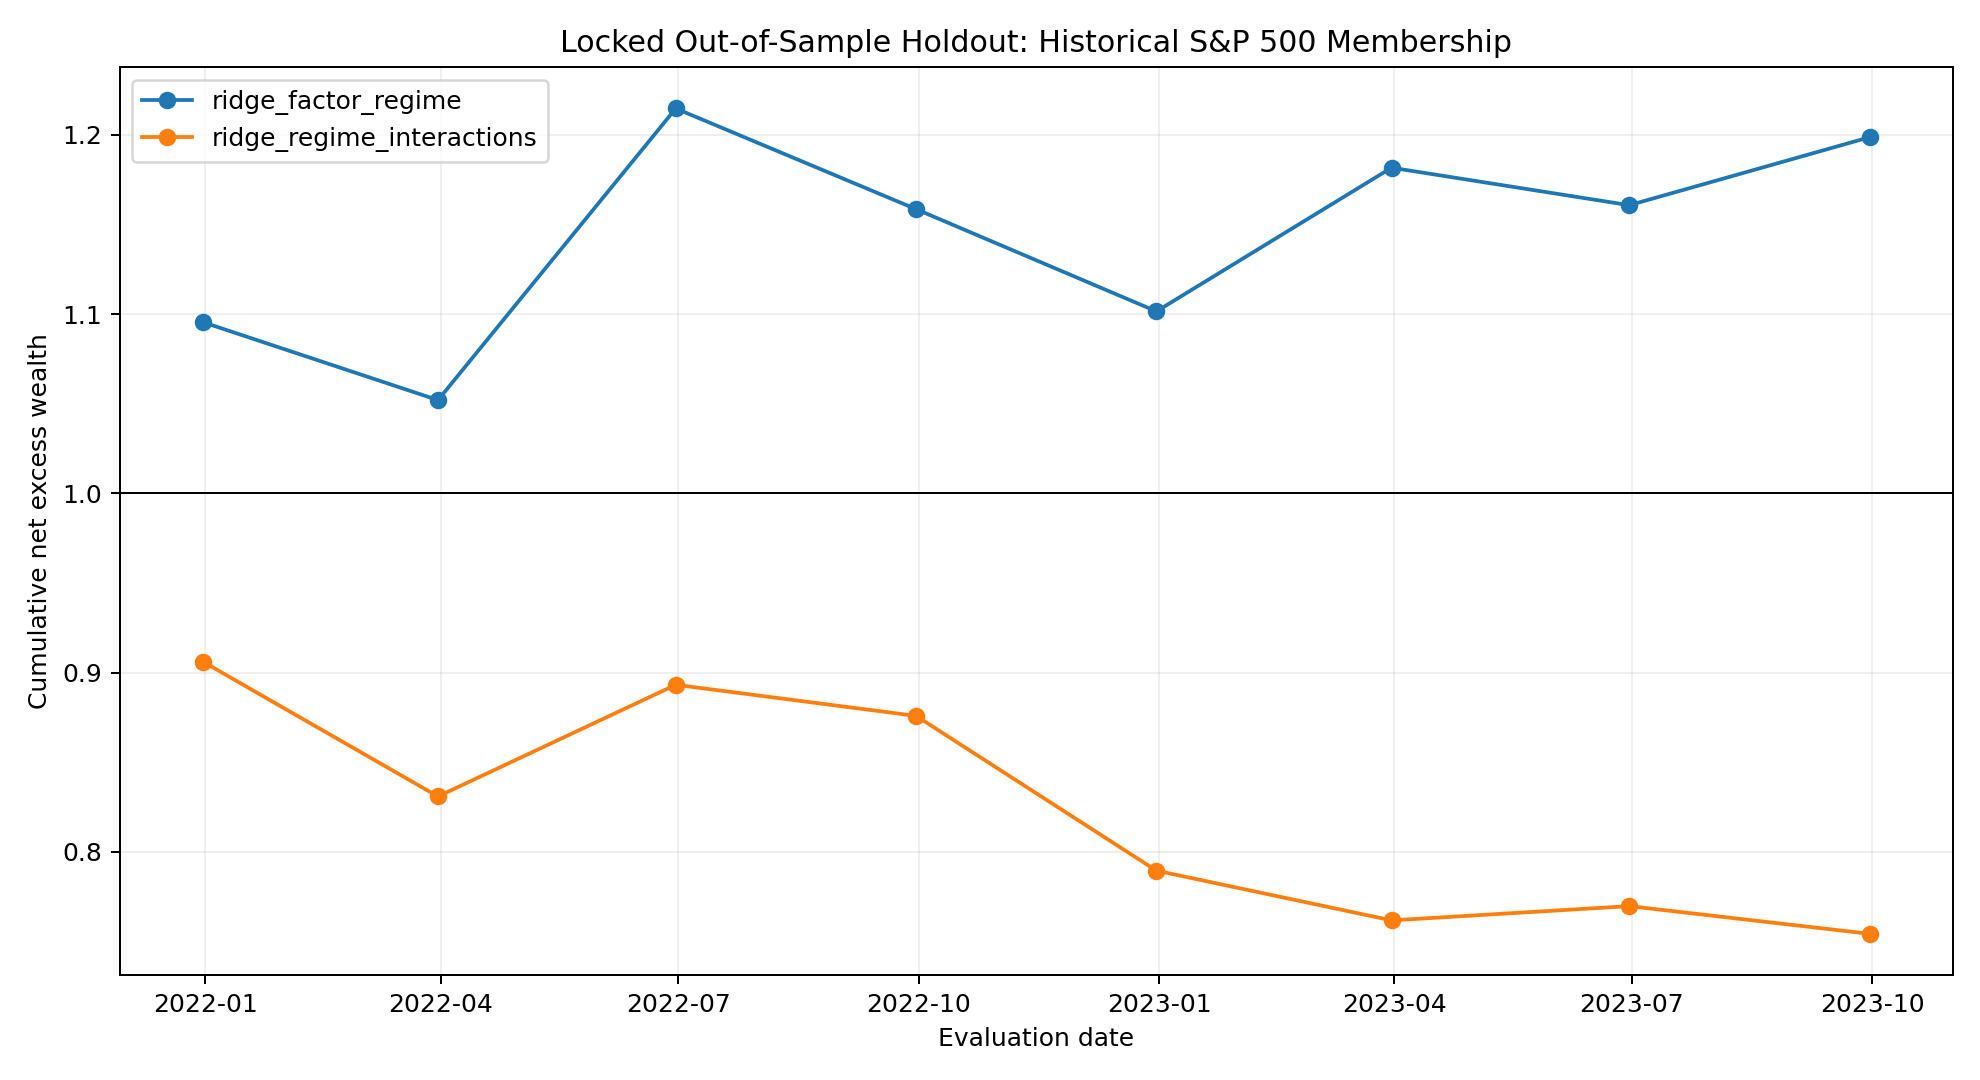
All rows below use the same historical-membership holdout, eight quarterly evaluation periods, Top-5 selection, and 0.5% transaction cost.
| Model | OOS R² | Direction | Rank corr. | Mean q. net excess | Terminal wealth |
|---|---|---|---|---|---|
| Gradient Boosting | 0.042 | 60.1% | 0.0315 | 8.25% | 1.765 |
| Elastic Net | -0.023 | 50.4% | -0.0156 | 2.40% | 1.161 |
| Huber | -0.055 | 48.4% | -0.0205 | 0.10% | 0.980 |
| Ridge | -0.049 | 48.7% | -0.0211 | -3.31% | 0.754 |
Robustness and inference
The result changes after stricter checks
| Test / quantity | Value | Interpretation |
|---|---|---|
| Raw alpha p-value | 0.0395 | Nominal significance before corrections |
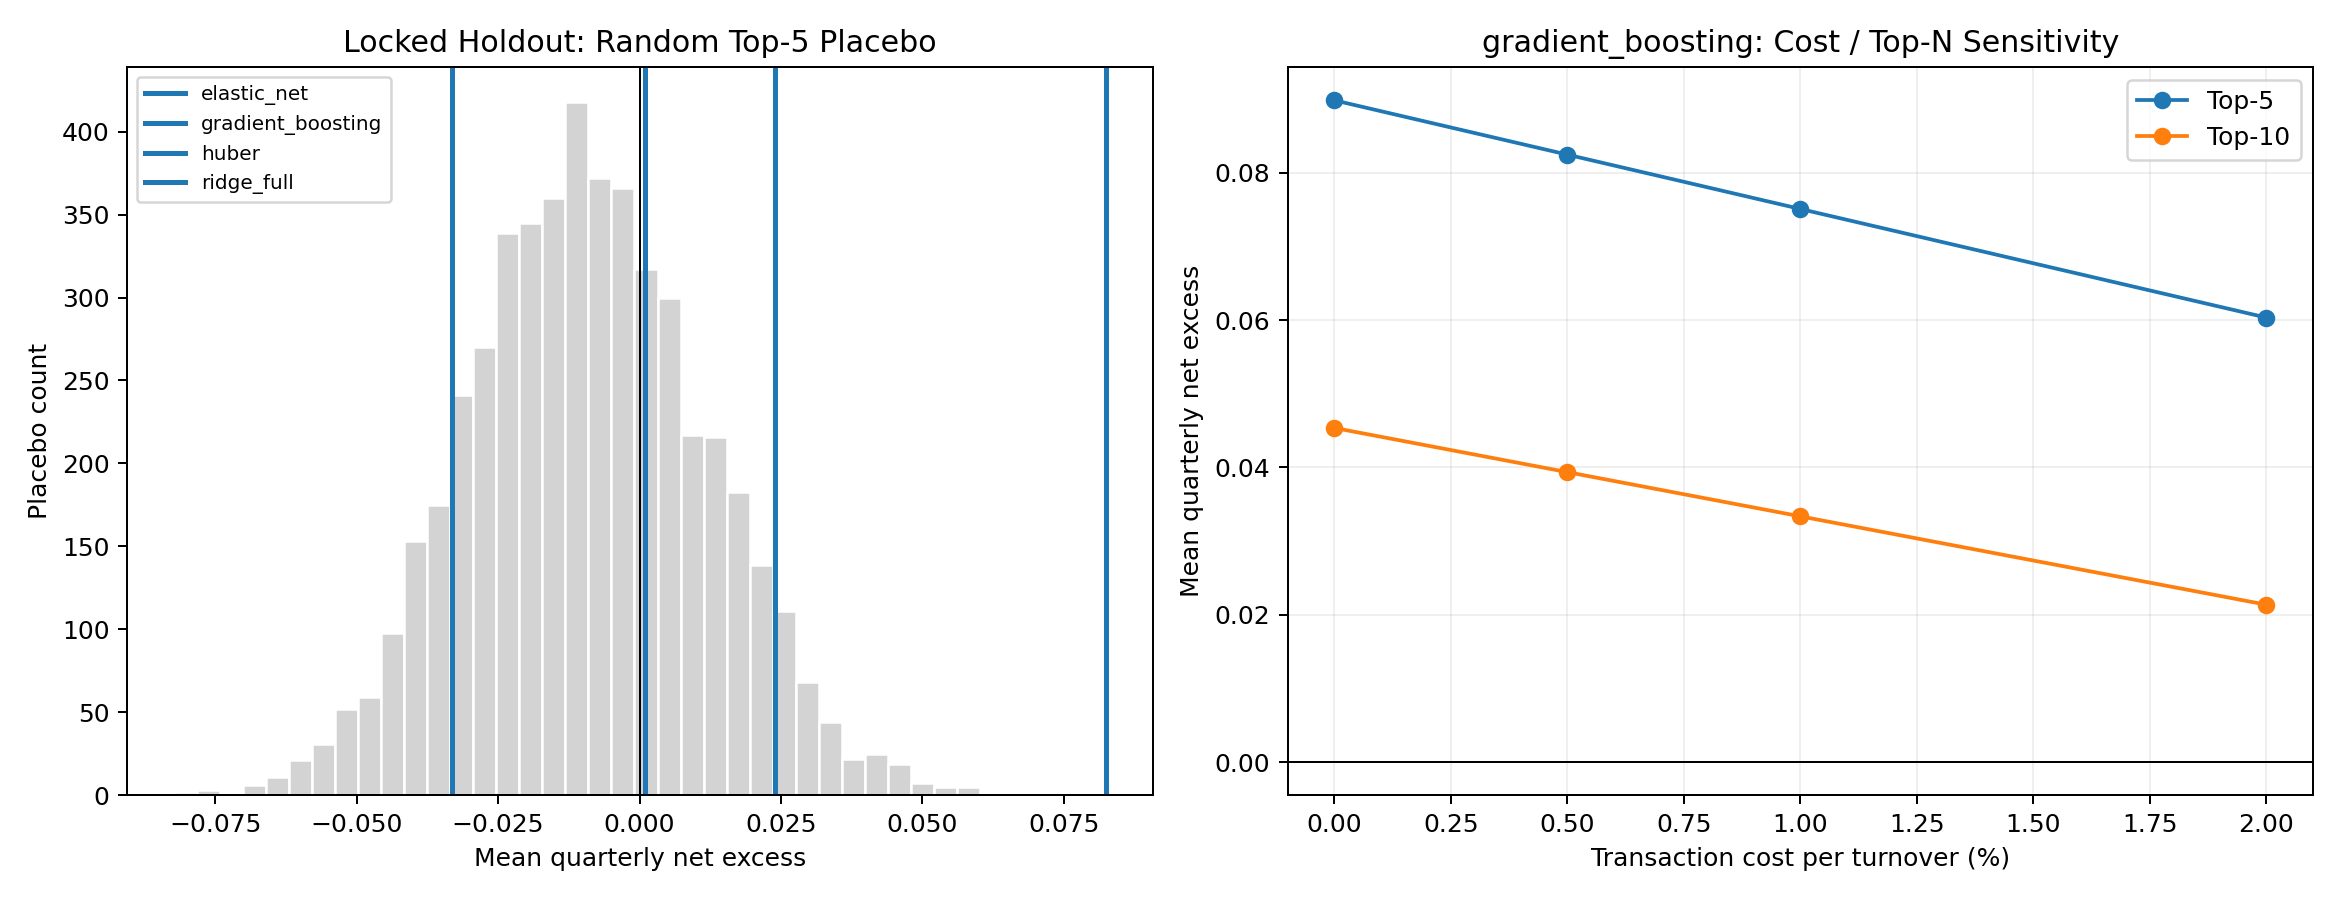
| Random Top-5 placebo p-value | 0.0002 | Observed portfolio beats random selection |
| Moving-block bootstrap p-value | 0.1237 | Not significant after dependence-aware resampling |
| Reality Check p-value | 0.1361 | Not significant after four-model selection |
| Bootstrap 95% interval | [-1.26%, 21.83%] | Wide interval due to only eight quarters |
Implementation sensitivity
Transaction costs and portfolio breadth
| Cost per turnover | Top-5 mean q. net excess | Top-10 mean q. net excess |
|---|---|---|
| 0% | 8.98% | 4.54% |
| 0.5% | 8.25% | 3.94% |
| 1% | 7.51% | 3.34% |
| 2% | 6.03% | 2.14% |
The signal remains positive in this sample at 2% cost, but portfolio performance is not the same as statistical proof. Costs, turnover, liquidity, and the small number of holdout periods remain central limitations.
Factor expansion
More features did not automatically improve the model
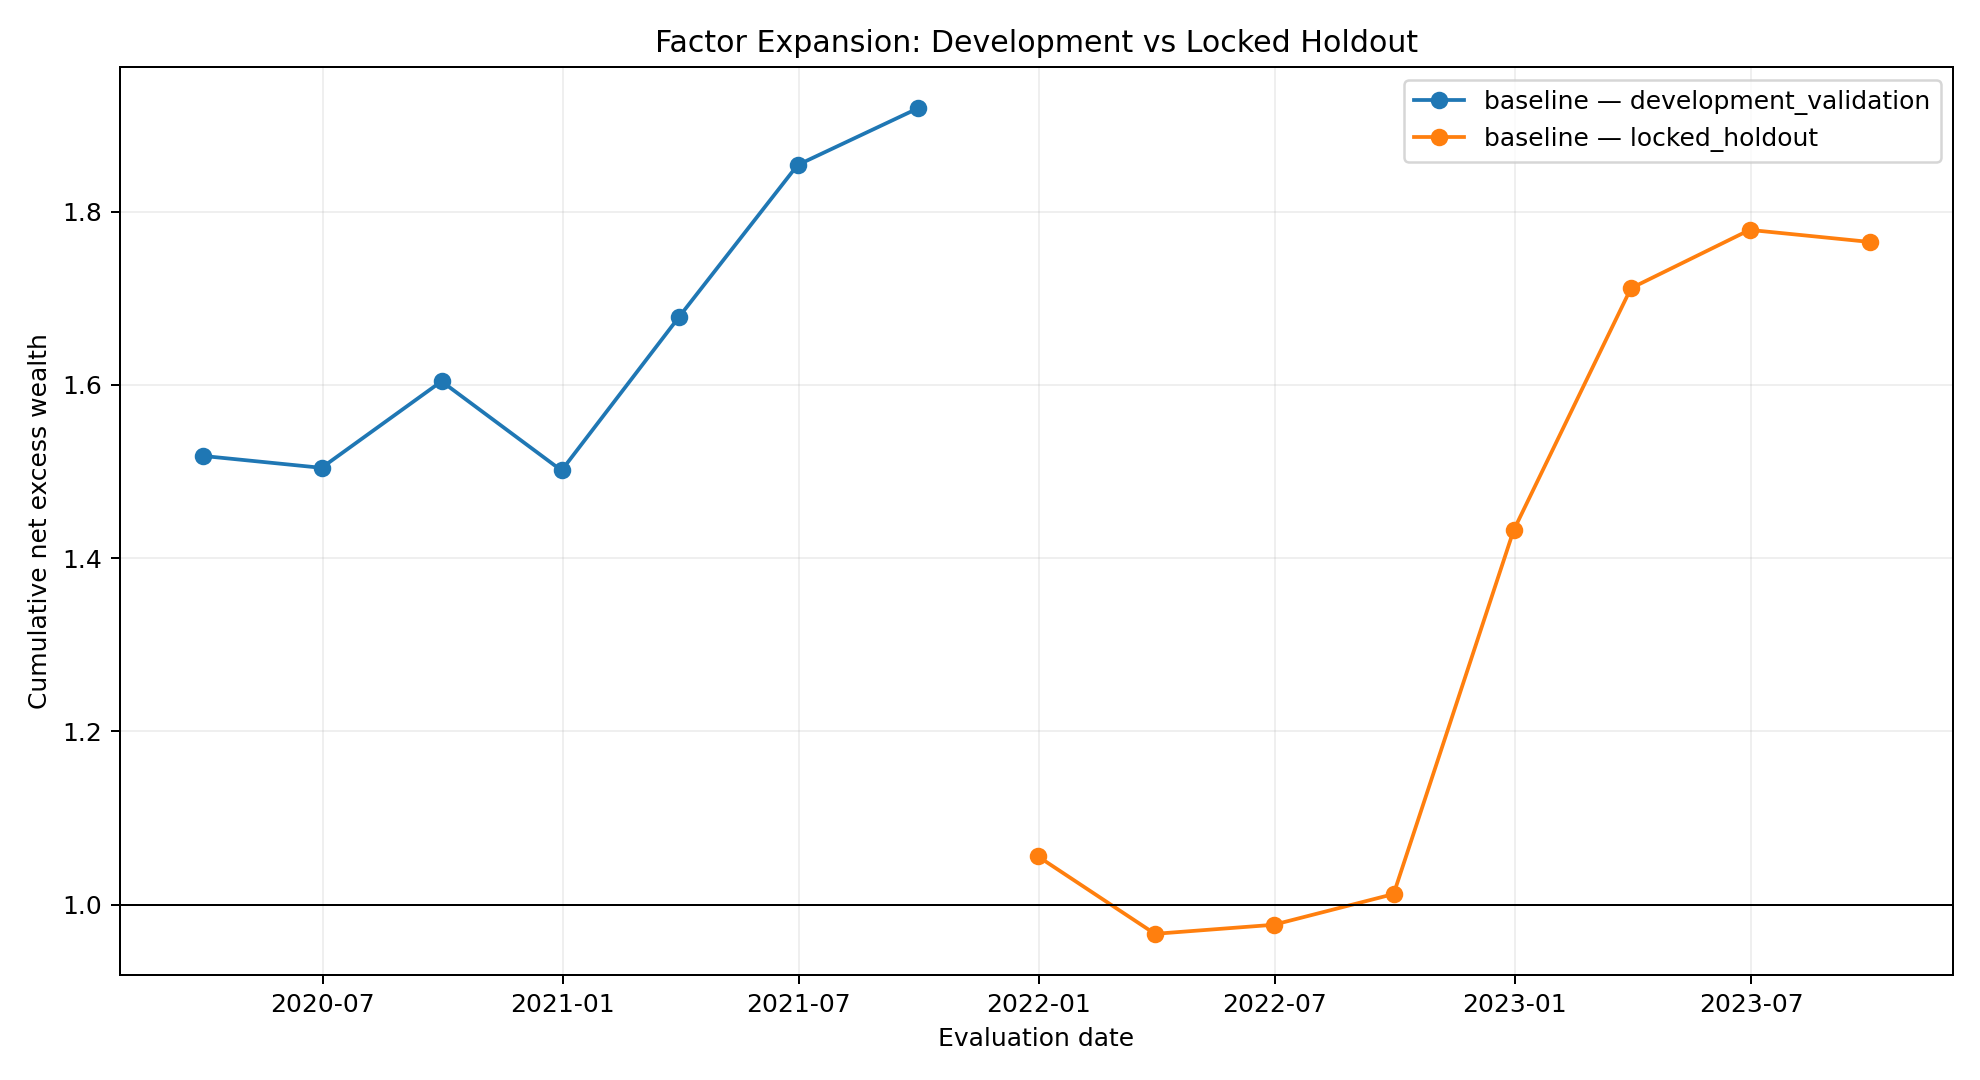
| Factor block | Mean q. net excess | Terminal wealth | Alpha p |
|---|---|---|---|
| Baseline | 8.25% | 1.765 | 0.0395 |
| Baseline + momentum | -1.13% | 0.886 | 0.2220 |
| Baseline + momentum/risk | -5.39% | 0.612 | 0.0009 |
| Full factor block | -2.83% | 0.767 | 0.0083 |
The baseline is intentionally retained because it performs better on the locked holdout. This is a useful negative result: complexity was treated as a hypothesis to test, not as an automatic upgrade.
Final takeaway
The useful conclusion is also a limitation
The model looks interesting in the first comparison, but the locked holdout and multiple-testing checks make a strong alpha claim hard to defend. That is the conclusion I would carry forward: the pipeline is reusable, while this particular signal still needs more data before it deserves to be called persistent.
Read the code and reports on GitHub